How data visualization can be used to better communicate predictive analytics
February 02, 2022
Visual solutions chip away at the complexity of predictive data by acting as an interpretive tool, thus creating the perfect synergy
What are predictive analytics?
Predictive analytics is the arm of business intelligence that surpasses data contextualization for the current state. It uses historical information to predict future business results, behaviors, and forward-looking patterns with remarkable precision.
Predictive analysis, empowered by machine learning and AI, can help improve overall customer experience, prioritize leads, reduce risk, increase efficiency, and boost revenue across an array of sectors.
How can firms take advantage of predictive analytics?
Modern firms need a way to quickly explicate big data in response to evolving global and customer expectations.
For leaders of these firms, however, the missing puzzle piece is how to effectively communicate the powerful storytelling of predictive analytics. In the past, these extremely technical tasks would be relegated to data scientists.
Introduce self-serve interactive data visualization. Leveraging the automated tools that exist today, leaders are able to dive into their own analytics and uncover valuable insights.
By visualizing data, firms can accentuate time series forecasting, identify relationships through clustering, and encourage confident data-driven decision making.
A growing trend
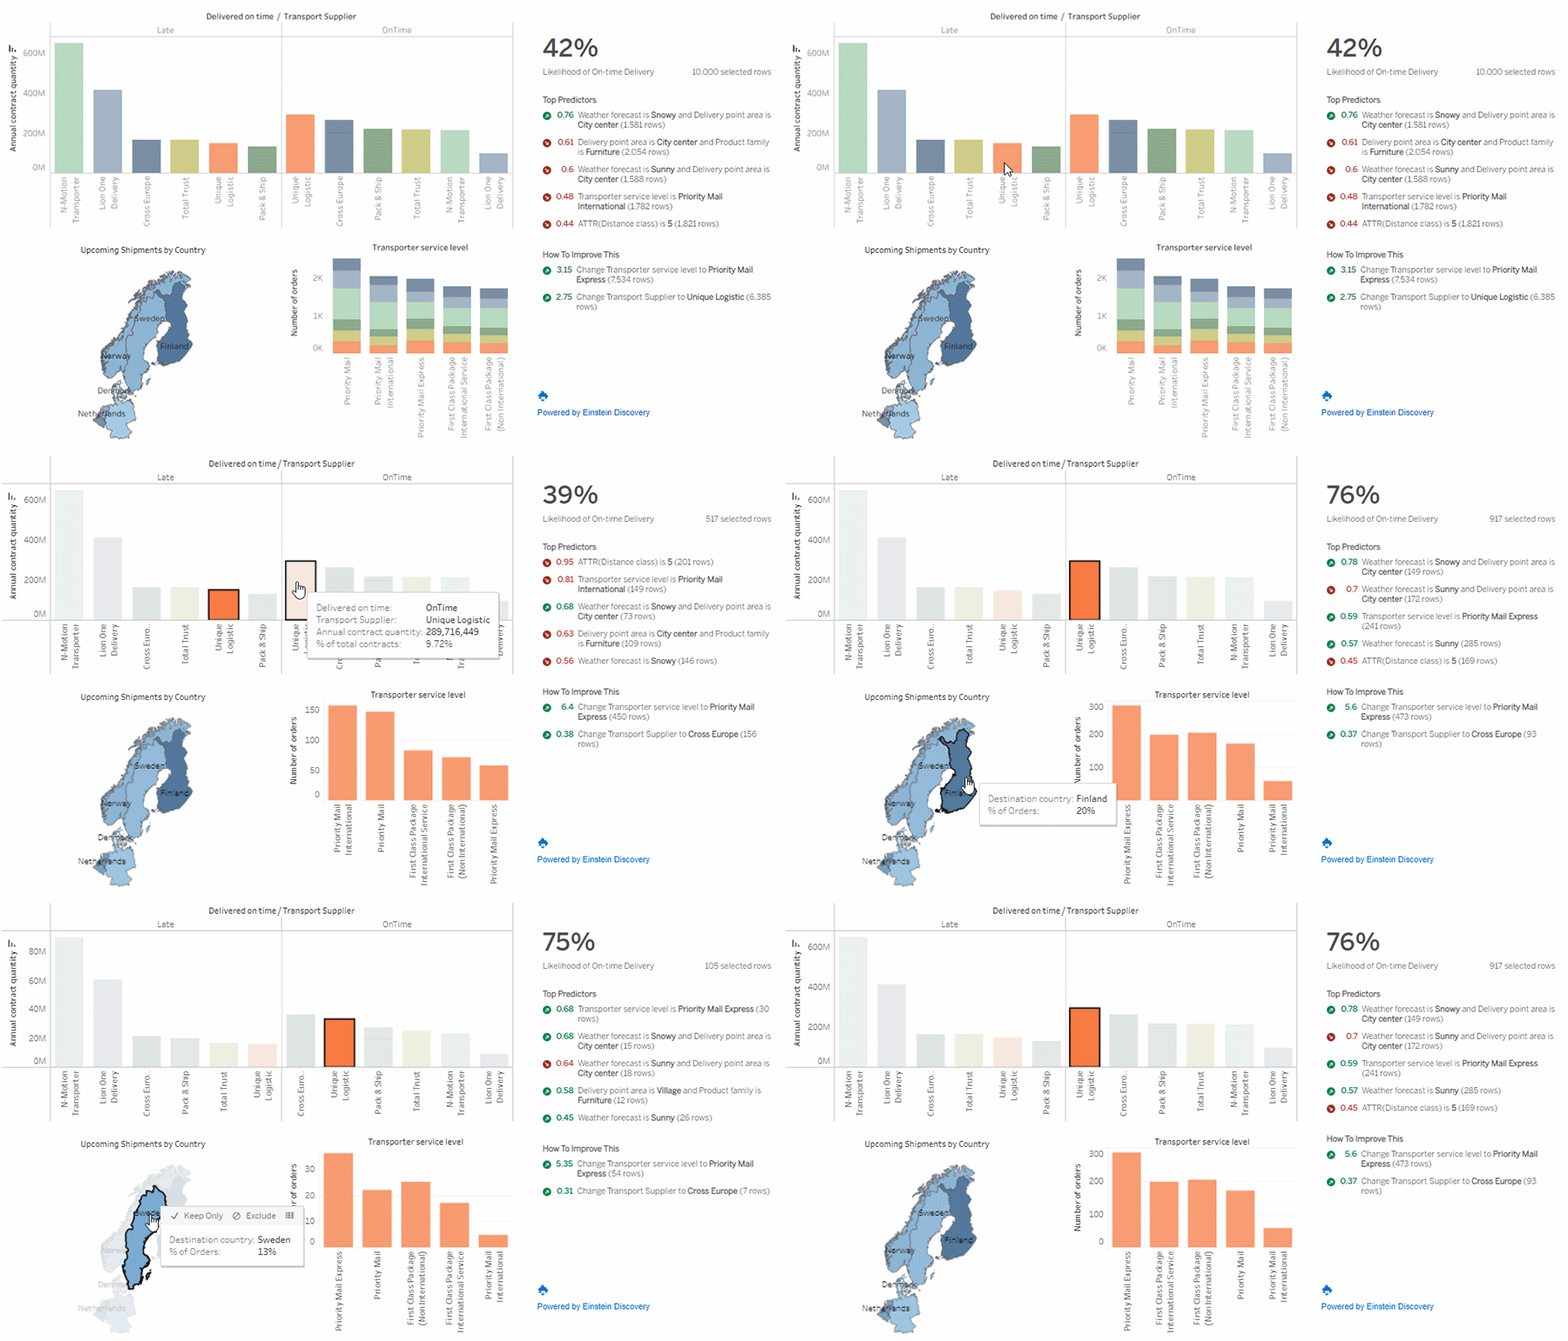
Salesforce has prioritized business science, a new class of AI predictive analytics, within its suite of applications through its acquisition of Tableau. By fusing brand recognition from Einstein Discovery’s real-time predictive analysis with newly-acquired Tableau, Salesforce enabled customers to proactively discover insights and trends across millions of rows of data in seconds without requiring highly sophisticated querying models.
Visual solutions chip away at the complexity of predictive data by acting as an interpretive tool. When it comes to predictive analytics, a picture really is worth 1,000 words.

Animation courtesy of Tableau
Predictive analytics and machine learning; a powerhouse one-two punch
Machine learning solutions are the pioneers in democratizing data science. They bring predictive capabilities to the existing dashboards that most companies already have.
Azure Machine Learning complements core tools like Power BI in the predictive analytics lifecycle. Power BI brings the predictive power of advanced analytics to allow users to quickly create interactive models and visualize results by dragging and dropping.
Consider this scenario; if a firm wanted to boost revenue by optimizing collection efficiency, a predictive model can be set up with Azure Machine Learning. This model can be leveraged by the credit & collections team to create decision trees that answer questions like who’s likely to pay versus who isn’t. Predictive insights from the model can also be used to analyze customer behavior and be more proactive, i.e. some customer types and geographies benefit from phone contact versus online.
A dataflow connection to Power BI can then be used to transform predictions from the machine learning model into powerful visualizations and dashboards, enabling the collections team to make informed and actionable decisions.
If you are interested in learning more about how Lionpoint Group’s Business Intelligence capabilities can benefit your firm, click here or send an email to info@lionpointgroup.com